The dashboard has twelve toggleable layers plus live data feeds. Turning everything on at once is overwhelming — and not useful. This guide walks through the order that actually tells the story: terrain → drainage → orientation → population → historic validation → live gauges → official warnings. Seven core steps to get the picture; two more to compare alternatives; plus the named-rivers reference layer and the power-user extras (presets, search, keyboard shortcuts, gauge sparklines, shareable point links) at the end.
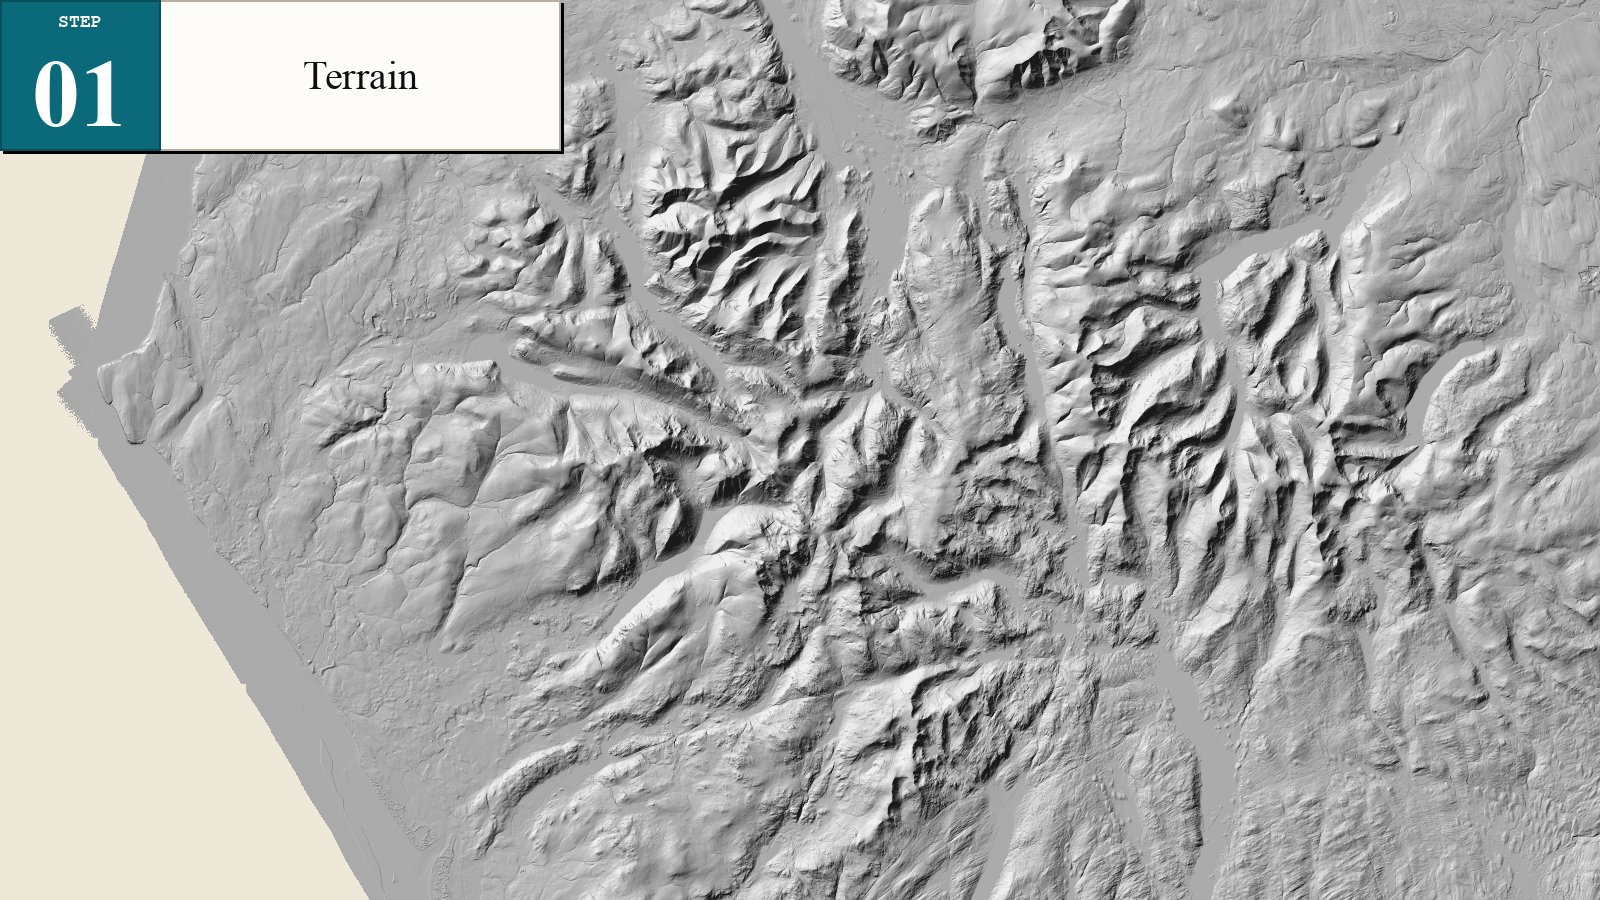
The bare relief. EA 1 m LIDAR Composite rendered as a north-west-illuminated hillshade. See the shape of Cumbria — Skiddaw + Bassenthwaite north; Buttermere + Wasdale west; Scafell central; Helvellyn + Ullswater east; Eden basin to the north-east; coastal plain west.
The dark voids around the edges are where LIDAR doesn't cover — Solway Firth (NW), Irish Sea (W), Pennine fringe (E).
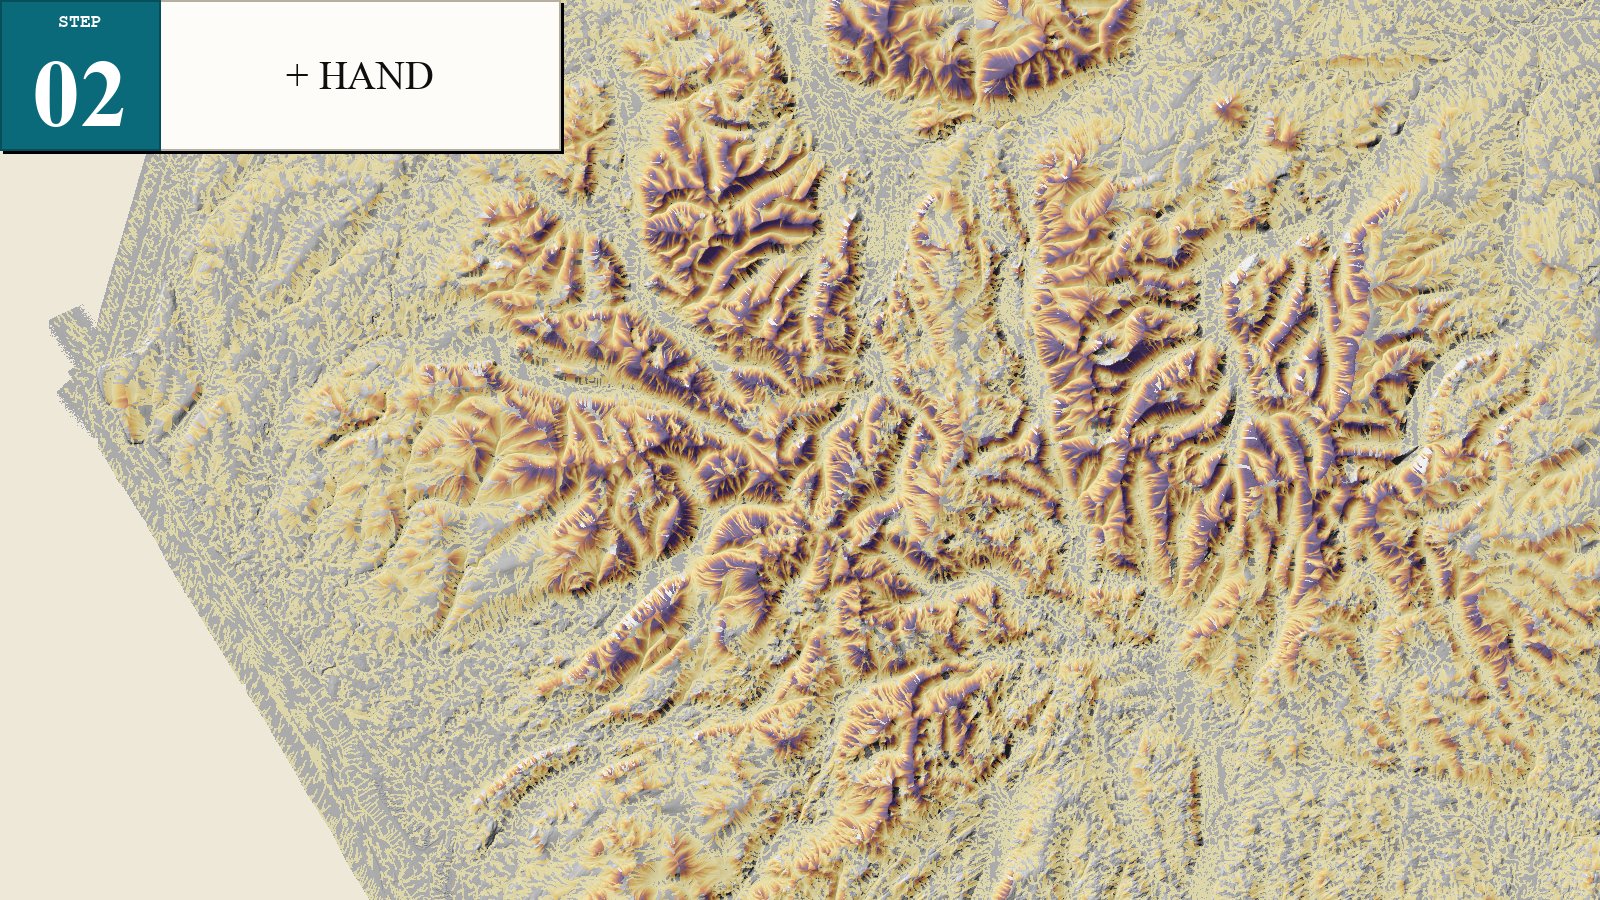
HAND (Height Above Nearest Drainage, Nobre et al. 2011) tints each cell by how high it sits above the nearest stream.
Yellow valleys = at or near channel level (potentially flood-prone). Orange / brown = mid-slopes. Purple ridges = upland, hydrologically safe.
Channel-init threshold: 0.025 km² (2.5 ha) — chosen empirically against real-world river networks; defensible for UK flood mapping.
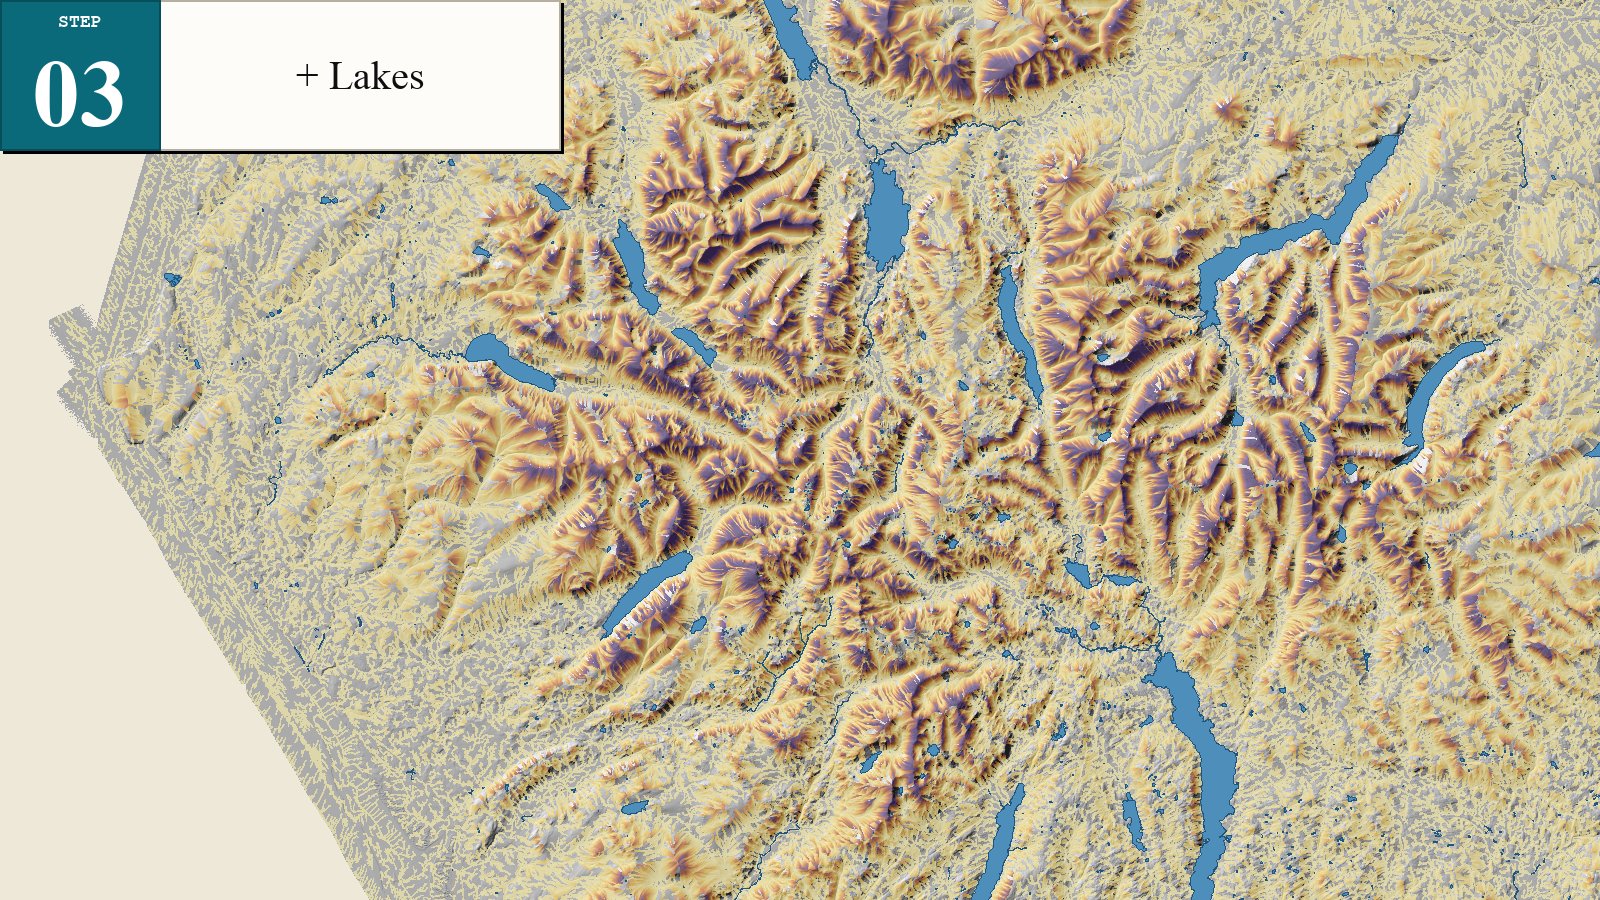
Add the lakes. Bassenthwaite, Derwentwater, Buttermere, Crummock, Wast Water, Loweswater, Ullswater, Thirlmere, Coniston, Windermere — instantly the map becomes readable for anyone who knows Cumbria.
Source: OpenStreetMap natural=water polygons + multipolygon relations (ODbL). 2,370 lake + tarn polygons within the extent, including Red Tarn at Helvellyn and all named tarns.
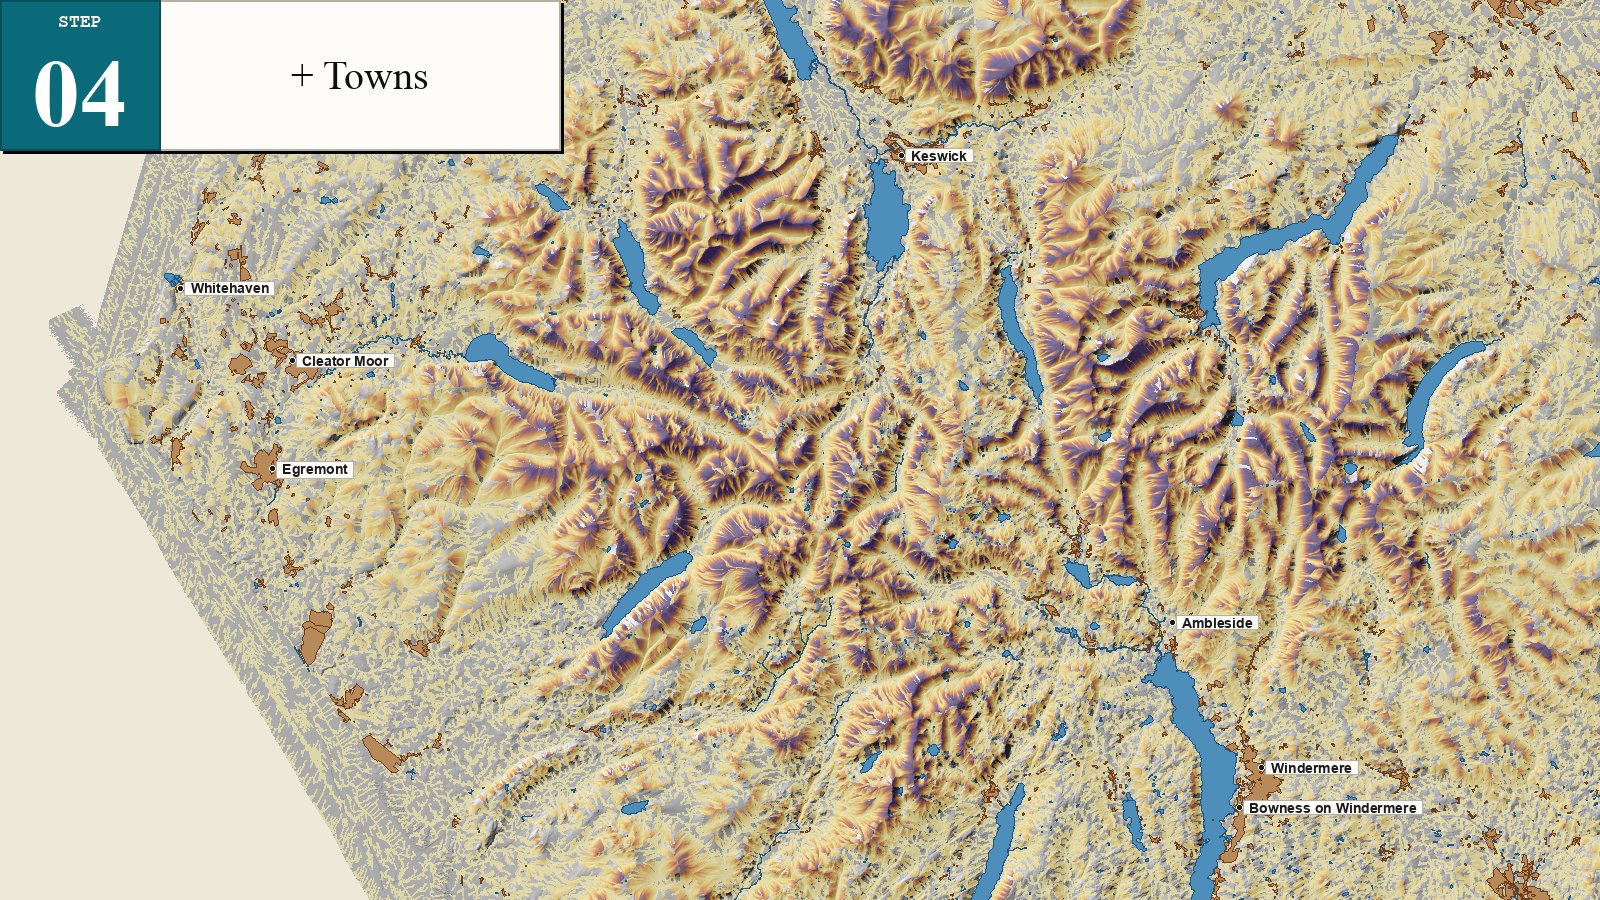
Now the question stops being abstract. Cockermouth, Keswick, Workington, Whitehaven, Egremont, Penrith, Kendal, Ambleside, Windermere, Bowness — the towns at risk.
Brown polygons = OSM residential/commercial/industrial footprints (built-up land). Black-edged dots = named place centroids; major towns labelled at all zooms, villages appear when zoomed in.
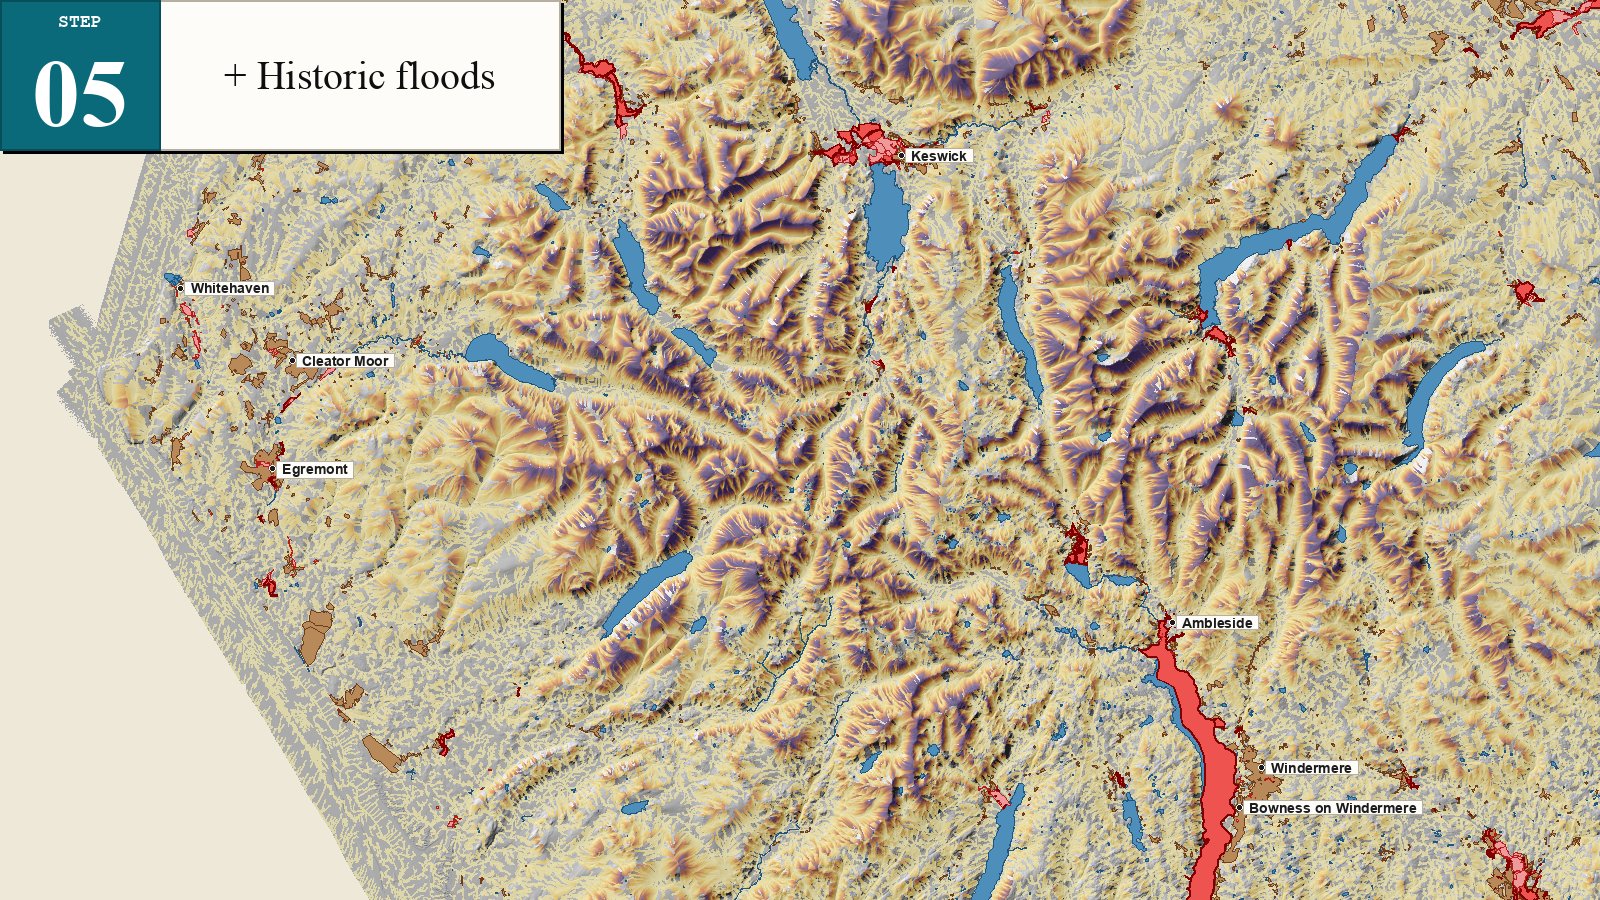
EA Recorded Flood Outlines (OGL v3) — actual flooded extents from the EA's records. 901 polygons across 348 events within Cumbria, including:
• Cockermouth November 2009 (the catastrophic flood that triggered the EA's modern flood-defence rebuild)
• Storm Desmond December 2015 (Carlisle, Keswick, Kendal — 65 flooded areas in one event)
• Storm Dennis 2020, Storm Ciara 2020, Storm Henk 2024, Brigham 2025
Major 2009 + 2015 events are styled darker red and slightly more opaque.
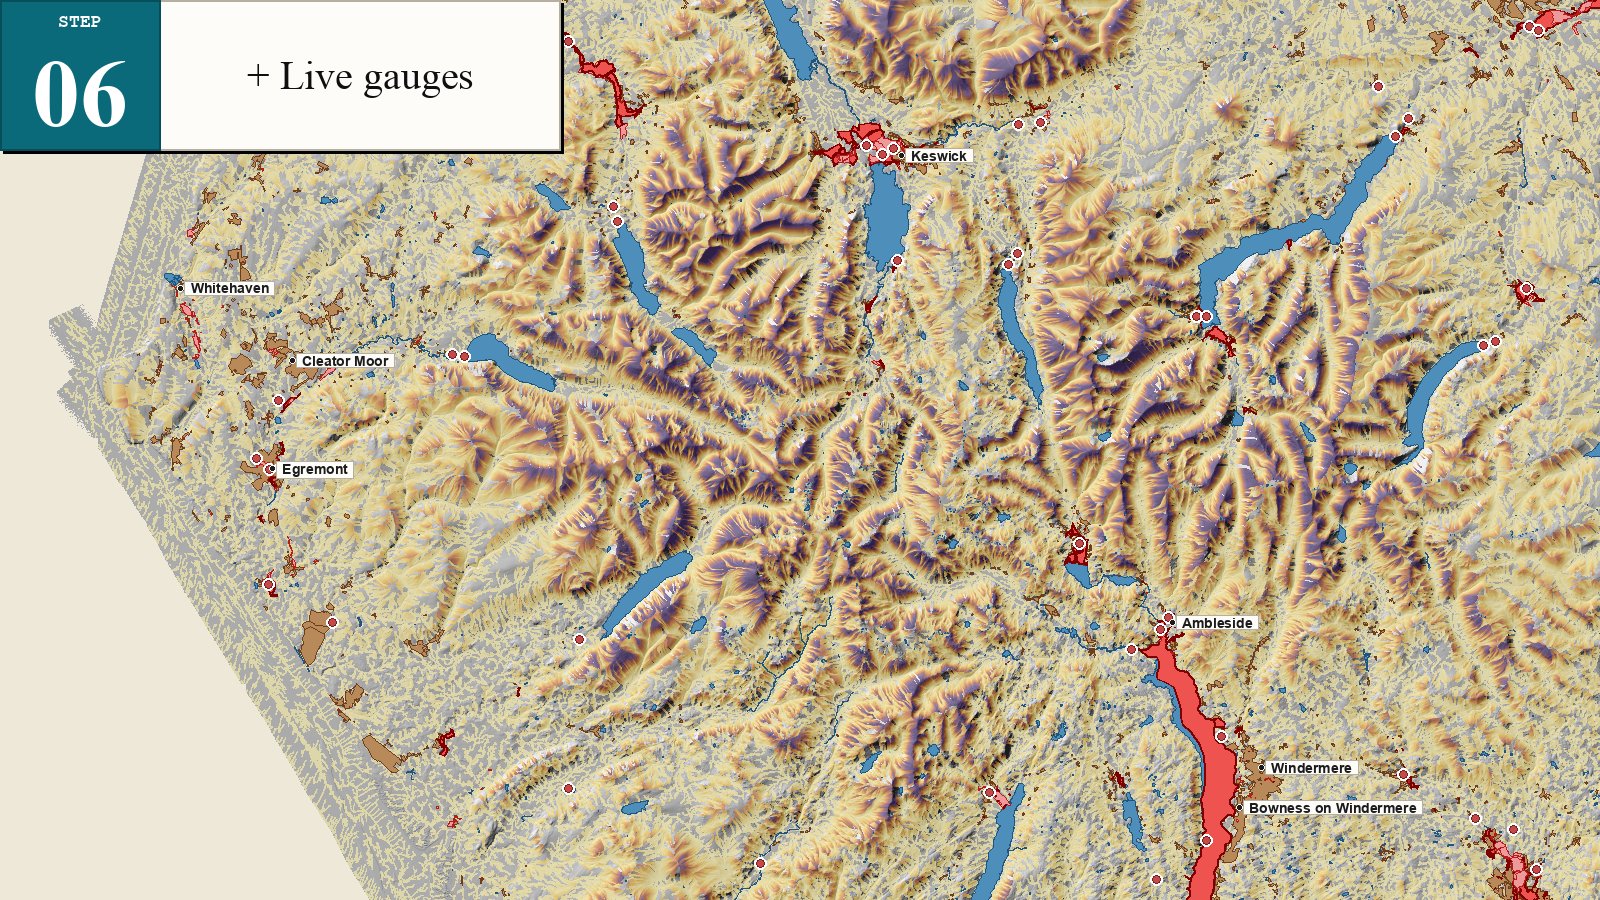
Red dots overlay every EA Real-Time Flood-Monitoring station within Cumbria — 76 water-level gauges along the Eden, Cocker, Derwent, Greta, Kent, Ehen, Duddon and the smaller becks.
The station list (locations, river names) is cached in a small JSON and refreshed automatically each week via a GitHub Actions cron. The actual water-level readings are not cached — they're fetched directly from the EA API the moment you click a dot.
The EA Flood Warning Areas are the 87 statutory zones (within Cumbria) that the Environment Agency uses to alert residents when river or sea flooding is imminent. Each polygon corresponds to a specific bit of floodplain or coast — e.g. "Cocker Lane, Cockermouth", "Keswick — Brundholme Road to Greta Bridge", "Irish Sea coast at Allonby".
Source: EA Real-Time Flood-Monitoring API — /floodAreas endpoint (OGL v3). The zone list itself is cached weekly via the same GitHub Actions cron that refreshes the gauge list; it changes ~once a month.
/floods endpoint and cross-references the active warnings against these polygons. Any zone with a live warning in force is highlighted (pulsing red outline + fill). A red banner appears across the top of the screen listing how many zones are affected.
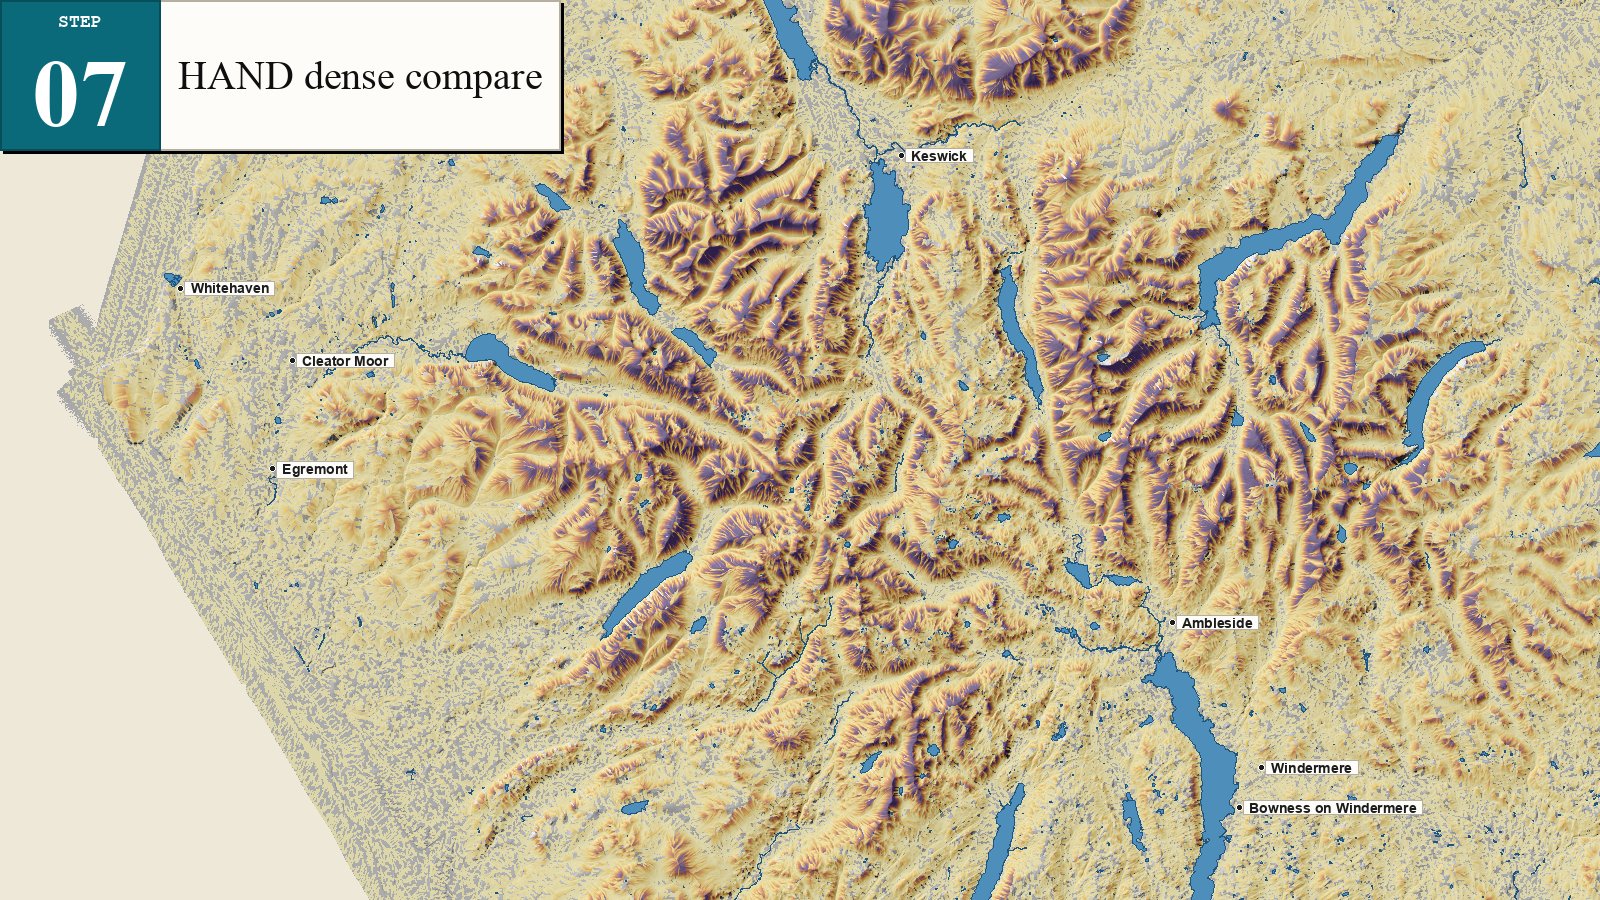
Lower the channel-init threshold from 0.025 km² → 0.01 km². More streams, more cells with HAND (45 % of land vs 35 %). The trade-off: small drainage ditches start to be counted as channels, so some areas of the lowlands are visibly over-extracted.
Toggle between them to see the genuine uncertainty in WHERE the algorithm draws the line.
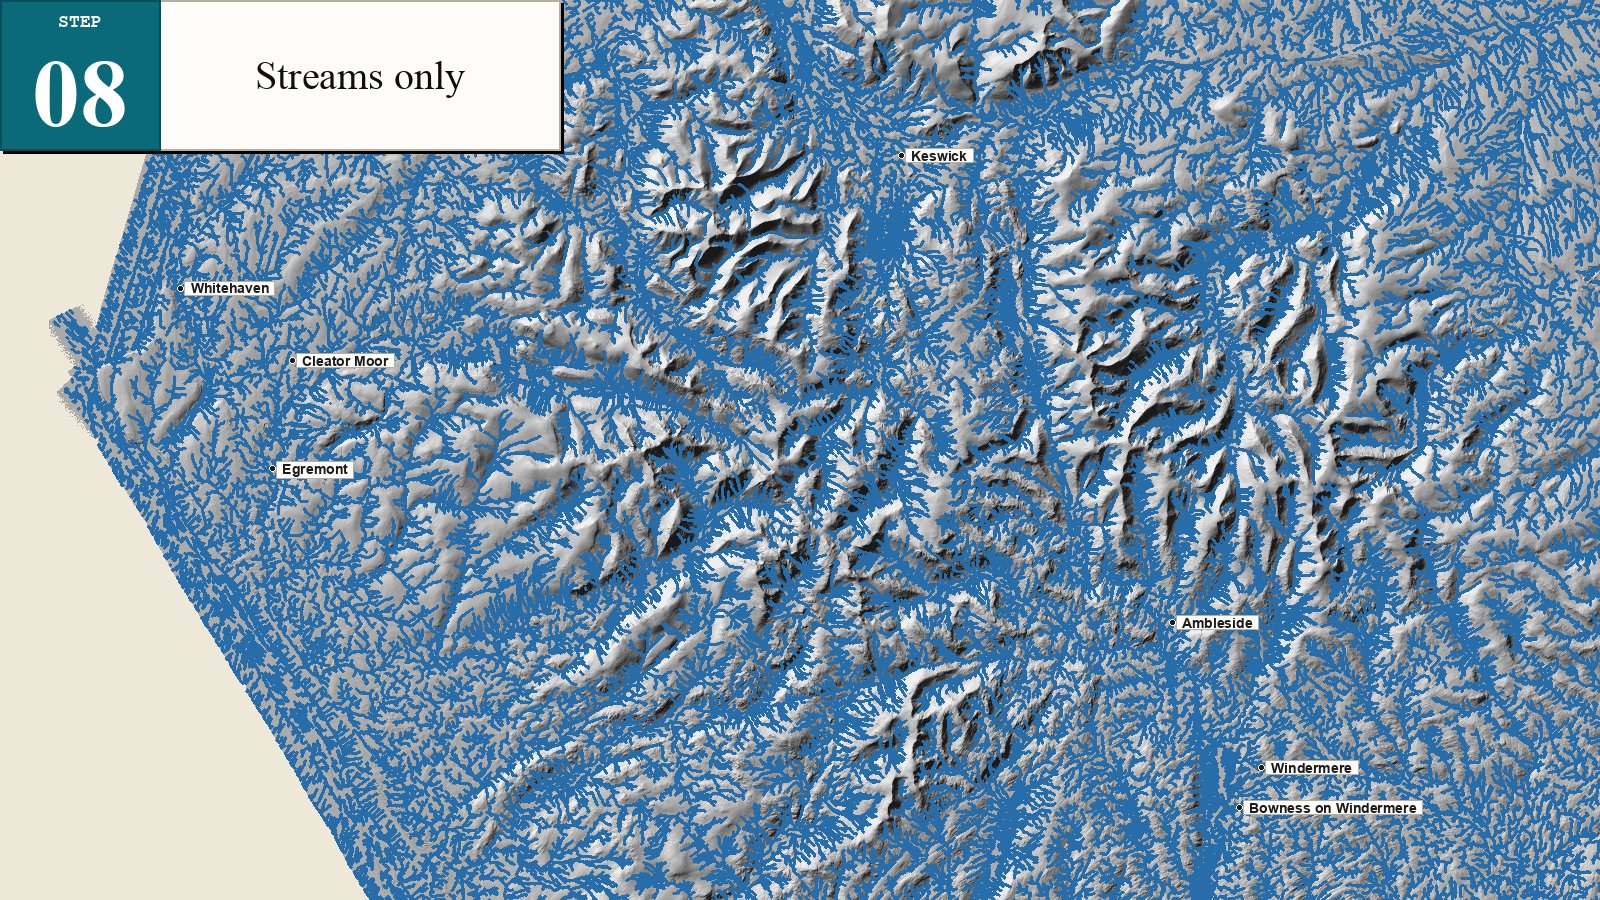
The extracted drainage network. Every blue line is a cell where the flow accumulation exceeds the 0.025 km² channel-init threshold. The blue web you see is what HAND measures distance to.
Compare against your mental map: Eden, Cocker, Derwent, Greta, Kent, Lune, Esk, Mite, Calder, Ehen, Bleng — all there.
Three semantic snap-to buttons at the top of the sidebar replace the abstract All on / All off approach: Flood-risk view (terrain + HAND + lakes + towns + historic + gauges + warnings + rivers — 8 layers), Hydrology research (DEM + HAND densities + streams + slope + TWI + rivers — 7 layers), Place orientation (just terrain + lakes + towns + rivers — 4 layers). One click snaps the whole layer stack to the right combination for the role you're playing.
Search box at the very top of the sidebar. Type a place ("Keswick") or a river name ("Cocker") — results appear instantly drawn from the OSM places + the 3,650 named waterways in L12. Selecting a place zooms to it; selecting a river fits the map to all its segments and pulses the line bright red for ~1.5 s so you can see WHERE the river actually is.
Power-user keys: 1–9 + 0 toggle L01–L10. / focuses the search box (vim-style). ? pops up a help reminder. Esc closes any open panel (already worked, now documented). Skipped automatically when you're typing in an input.
Click any red EA gauge dot — the popup now shows the current water level, a STABLE / HIGH / MID / LOW range badge, and an inline 24-hour sparkline with a red dot at the current value. One look tells you whether today's level is normal, a bit high, or near the 24h peak. The whole thing is a single fetch from the EA Real-Time API; no historical data is cached on our side.
Click anywhere on the map and a right-side panel collapses five separate lookups into one combined view: BNG coordinates, nearest named place, HAND / slope / TWI values at that exact spot, any historic flood polygons that contain the point, and the nearest live EA gauge with its current reading.
The URL bar always reflects your current zoom, centre, active layers, and the click-to-detail point (if open). Click Share view in the masthead to copy the URL — paste it to a colleague and they'll open the dashboard with the exact same map view, layer set, AND detail-panel point auto-restored after ~1.5 s. A toast confirms what was copied. One link instead of an instruction list.
A small pill in the masthead shows how many of the dashboard's data feeds responded successfully on this page load. Click it to see the per-source breakdown: HAND tiles, gauge list, flood polygons, warning zones, live warnings, etc. Green = everything live. Amber = some sources degraded (e.g. EA API rate-limit) but core dashboard still works.
Three small text buttons under the presets. Reset returns to the recommended default (Step 6 layers + full Cumbria view). All on shows every layer at once (busy — for inspection). All off clears everything (useful for the bare hillshade). With the new presets above, these are now power-user fallbacks rather than the primary controls.
Small black bar pops up at the bottom of the map whenever something happens — a preset is applied, a layer toggles via keyboard shortcut, the Share view URL is copied, the click-to-detail panel opens for the first time, etc. Auto-hides after a couple of seconds. Honest feedback so you know your click actually did what you expected.
When the Environment Agency reports a live flood warning, the matching warning-zone polygon already changes colour (red for warning/severe, amber for alert). It now also pulses every 1.5 seconds — heavier stroke, darker border, slightly higher fill opacity. Subtle enough not to be annoying, consistent enough to draw the eye to whichever bits of Cumbria are currently in alert. Respects prefers-reduced-motion — if you've enabled that system-wide, no pulse.
Click anywhere on the map → the click-to-detail panel shows the nearest named place. A small ↗ icon next to the name now opens that place's Wikipedia article in a new tab. Useful for "where the hell IS Mungrisdale anyway?" or quickly reading the history of a hamlet you've never heard of. Tiny villages without their own Wikipedia article land on a search-results page rather than a 404.
Masthead button next to Share view. Click it → toast appears + your browser's Print dialog opens. From there pick "Save as PDF" (universal) or "Save as image" (Chrome / Edge). The print stylesheet hides the sidebar + masthead + intro card so the saved file shows just the map, the BNG/HAND readout strip, the scale bar, and the attribution. Useful for emails, reports, sharing a specific moment on social media.
Append ?embed=1 to any dashboard URL and the masthead + sidebar + intro card all hide. The map fills the entire viewport. Combine it with the URL hash (#l=…&v=…&p=…) and you get a locked, full-bleed embedded view perfect for <iframe>ing into a news article, blog post, or social-media card.
The dashboard is now a Progressive Web App. On mobile (iOS Safari, Android Chrome) you can "Add to Home Screen" — launches the dashboard fullscreen with no browser chrome, like a native app. A service worker caches all the static assets so repeat visits load instantly, and the dashboard keeps working offline using the last-known data (with the live gauges naturally going stale until reconnected).
Small pill in the masthead showing how many of the dashboard's data feeds responded successfully. Green dot · "13 sources · all live" means everything's healthy. While loading you'll see "loading 13 / 17" with a real progress count. Amber = some sources degraded. Red = something failed. Click the pill to see the per-source breakdown.
Two more LIDAR-derived layers, default off. Slope (magma ramp, degrees) highlights steep fellsides — runoff-prone terrain. TWI (Topographic Wetness Index, Beven & Kirkby 1979) shows saturation-prone valley bottoms vs dry ridges. Useful for hydrology research; not essential for first-glance flood reading.
Hover the map: live BNG Easting/Northing + the sampled HAND in metres, slope in degrees, and TWI at your cursor position. Sampled from a small 1000×1000 lookup raster — values shown to ~3 m precision.
What the colours mean for HAND, slope, and TWI — plus the rough flood-risk interpretation thresholds (0–5 m: floodplain · 5–15 m: 1-in-100 risk · 50 m+: upland safe). Anchored in Nobre 2011 + the Cumbria case-study record.
Three one-click jumps to authoritative live/forecast sources: EA river & sea levels (official), Google Flood Hub (Nevo 2022 ML), Met Office warnings. Not yet ingested programmatically (planned Sprint 6+).
A GitHub Actions cron runs every Sunday at 04:00 UTC, re-fetches both the EA stations list and the EA Flood Warning Areas list, and auto-deploys to Cloudflare Pages if anything changed. The dashboard always reflects the EA's current station + zone inventory. The live water-level readings + live warning state are fetched browser-side on demand — no refresh needed for those.